DataViz in R | 03B. Bar Chart Multiple Responses and Questions
Playing with EVS data in previous post
library(ggplot2)
library(viridis)
library(dplyr)
theme_set(theme_minimal())
#load the data that I have extracted
evs <- readRDS("./myData/EVS_2008/germany.Rda")
head(evs)| v106 | v159 | v160 | v161 | v162 | v163 | v164 | v165 |
|---|---|---|---|---|---|---|---|
| <hvn_lbll> | <hvn_lbll> | <hvn_lbll> | <hvn_lbll> | <hvn_lbll> | <hvn_lbll> | <hvn_lbll> | <hvn_lbll> |
| 2 | 4 | 1 | 4 | 3 | 3 | 4 | 3 |
| 2 | 3 | 2 | 2 | 2 | 2 | 4 | 4 |
| -3 | 1 | 3 | 3 | 3 | 1 | 1 | 1 |
| -3 | 1 | 4 | 2 | 3 | 1 | 1 | 2 |
| -3 | 3 | 1 | 1 | 2 | 3 | 2 | 3 |
| 2 | 2 | 2 | 2 | 2 | 2 | 2 | 1 |
#Using library haven and labelled to read or extract the label(s)
library(haven)
library(labelled)
head(evs$v159)
<labelled<double>[6]>: working mother warm relationship with children (Q48A)
[1] 4 3 1 1 3 2
Labels:
value label
-5 other missing
-4 question not asked
-3 not applicable
-2 no answer
-1 don't know
1 agree strongly
2 agree
3 disagree
4 disagree strongly#Using val_labels, we see that the values for 7 cols are the same: from -5 to 4
val_labels(evs)$v159 other missing -5 question not asked -4 not applicable -3 no answer -2 don’t know -1 agree strongly 1 agree 2 disagree 3 disagree strongly 4
$v160 other missing -5 question not asked -4 not applicable -3 no answer -2 don’t know -1 agree strongly 1 agree 2 disagree 3 disagree strongly 4
$v161 other missing -5 question not asked -4 not applicable -3 no answer -2 don’t know -1 agree strongly 1 agree 2 disagree 3 disagree strongly 4
$v162 other missing -5 question not asked -4 not applicable -3 no answer -2 don’t know -1 agree strongly 1 agree 2 disagree 3 disagree strongly 4
$v163 other missing -5 question not asked -4 not applicable -3 no answer -2 don’t know -1 agree strongly 1 agree 2 disagree 3 disagree strongly 4
$v164 other missing -5 question not asked -4 not applicable -3 no answer -2 don’t know -1 agree strongly 1 agree 2 disagree 3 disagree strongly 4
$v165 other missing -5 question not asked -4 not applicable -3 no answer -2 don’t know -1 agree strongly 1 agree 2 disagree 3 disagree strongly 4
Data wrangling
The negative values (from -5 to -1) are defined as missing values and are therefore not taken into account during statistical calculations. However, the answers of dk (don’t know) and na (no answer) gave us some insights because the question was indeed asked and the respondent has already provided an answer to it.
As a result, we will remove the negative values from -5 to -3 (other missing, not asked, and not applicable) and convert both no answer and don't know to a category of value.
#For this example we will drop the first column "v106" on the respondent's religious

evs <- evs[,-1]
head(evs)| v159 | v160 | v161 | v162 | v163 | v164 | v165 |
|---|---|---|---|---|---|---|
| <dbl+lbl> | <dbl+lbl> | <dbl+lbl> | <dbl+lbl> | <dbl+lbl> | <dbl+lbl> | <dbl+lbl> |
| 4 | 1 | 4 | 3 | 3 | 4 | 3 |
| 3 | 2 | 2 | 2 | 2 | 4 | 4 |
| 1 | 3 | 3 | 3 | 1 | 1 | 1 |
| 1 | 4 | 2 | 3 | 1 | 1 | 2 |
| 3 | 1 | 1 | 2 | 3 | 2 | 3 |
| 2 | 2 | 2 | 2 | 2 | 2 | 1 |
#Firstly we need to convert the data from "wider" to "longer" format
#i.e few columns, more rows - by pivot_longer in tidyr lib
#However, please keep in mind that the pivot_longer can not summary each value
#As can be seen from the dim(), the pivot dataframe has exactly 2075 x 7 = 14,525 rows

library(tidyr)
pivot_evs_longer <- pivot_longer(evs, cols=everything(), names_to = "Question", values_to = "Answer")
head(pivot_evs_longer)
dim(evs)
dim(pivot_evs_longer)| Question | Answer |
|---|---|
| <chr> | <dbl+lbl> |
| v159 | 4 |
| v160 | 1 |
| v161 | 4 |
| v162 | 3 |
| v163 | 3 |
| v164 | 4 |
- 2075
- 7
- 14525
- 2
#Then we use pivot_wider with values_fn to summary the data
#Remember to add values_fill for NA case
#https://stackoverflow.com/questions/28873057/sum-across-multiple-columns-with-dplyr

pivot_evs <- pivot_wider(pivot_evs_longer, names_from = "Answer", values_from = "Answer", values_fn = length, values_fill = 0)
pivot_evs| Question | 4 | 1 | 3 | 2 | -1 | -2 |
|---|---|---|---|---|---|---|
| <chr> | <int> | <int> | <int> | <int> | <int> | <int> |
| v159 | 112 | 803 | 311 | 782 | 67 | 0 |
| v160 | 337 | 332 | 655 | 647 | 101 | 3 |
| v161 | 477 | 163 | 769 | 523 | 138 | 5 |
| v162 | 490 | 174 | 708 | 553 | 147 | 3 |
| v163 | 43 | 851 | 205 | 909 | 64 | 3 |
| v164 | 52 | 772 | 205 | 985 | 55 | 6 |
| v165 | 70 | 568 | 447 | 887 | 96 | 7 |
#Create percentage columns
#This solution I asked ChatGPT from OpenAI and the result is good

pivot_evs %>%
mutate(Total = rowSums(select(., -Question)),
across(-c(Question, Total), ~./Total*100, .names = "{.col}_%"))| Question | 4 | 1 | 3 | 2 | -1 | -2 | Total | 4_% | 1_% | 3_% | 2_% | -1_% | -2_% |
|---|---|---|---|---|---|---|---|---|---|---|---|---|---|
| <chr> | <int> | <int> | <int> | <int> | <int> | <int> | <dbl> | <dbl> | <dbl> | <dbl> | <dbl> | <dbl> | <dbl> |
| v159 | 112 | 803 | 311 | 782 | 67 | 0 | 2075 | 5.397590 | 38.698795 | 14.987952 | 37.68675 | 3.228916 | 0.0000000 |
| v160 | 337 | 332 | 655 | 647 | 101 | 3 | 2075 | 16.240964 | 16.000000 | 31.566265 | 31.18072 | 4.867470 | 0.1445783 |
| v161 | 477 | 163 | 769 | 523 | 138 | 5 | 2075 | 22.987952 | 7.855422 | 37.060241 | 25.20482 | 6.650602 | 0.2409639 |
| v162 | 490 | 174 | 708 | 553 | 147 | 3 | 2075 | 23.614458 | 8.385542 | 34.120482 | 26.65060 | 7.084337 | 0.1445783 |
| v163 | 43 | 851 | 205 | 909 | 64 | 3 | 2075 | 2.072289 | 41.012048 | 9.879518 | 43.80723 | 3.084337 | 0.1445783 |
| v164 | 52 | 772 | 205 | 985 | 55 | 6 | 2075 | 2.506024 | 37.204819 | 9.879518 | 47.46988 | 2.650602 | 0.2891566 |
| v165 | 70 | 568 | 447 | 887 | 96 | 7 | 2075 | 3.373494 | 27.373494 | 21.542169 | 42.74699 | 4.626506 | 0.3373494 |
var_label(evs)$v159 ‘working mother warm relationship with children (Q48A)’
$v160 ‘pre-school child suffers with working mother (Q48B)’
$v161 ‘women really want home and children (Q48C)’
$v162 ‘being housewife as fulfilling as paid job (Q48D)’
$v163 ‘job best way for independence women (Q48E)’
$v164 ‘husband+wife contribute to household income (Q48F)’
$v165 ‘fathers as well suited to look after children as mothers (Q48G)‘
#However, we need to change the name of column also
#Adding the question desc
#To call a column with name as numeric character, use with ``
#use last_col()

Quesdesc = c("v159" = "A working mother can establish just as warm and\nsecure an environment as a non-working mother",
             "v160" = "A pre-school child is likely to suffer if\nhis or her mother is working",
             "v161" = "A job is alright, but what most women\nreally want is a home and children",
             "v162" = "Being a housewife is just as fulfilling as\nworking",
             "v163" = "Having a job is the best way for a woman\nto be independent",
             "v164" = "Both the husband and wife should contribute\nto the family income",
             "v165" = "In general, fathers are as well suited to\nlook after their children as women")

pivot_evs <- pivot_evs %>%
    mutate(Quesdesc = Quesdesc,
           Total = rowSums(select(., -Question)),
           "Agree strongly" = round(`1`/Total*100,2),
           "Agree" = round(`2`/Total*100,2),
           "Disagree" = round(`3`/Total*100,2),
           "Disagree strongly" = round(`4`/Total*100,2),
           ) %>%
    #We have to separate 2 mutate call due to the Total
mutate("n.a./don't know" = 100 - rowSums(select(.,`Agree strongly`:`Disagree strongly`)))pivot_evs| Question | 4 | 1 | 3 | 2 | -1 | -2 | Quesdesc | Total | Agree strongly | Agree | Disagree | Disagree strongly | n.a./don't know |
|---|---|---|---|---|---|---|---|---|---|---|---|---|---|
| <chr> | <int> | <int> | <int> | <int> | <int> | <int> | <chr> | <dbl> | <dbl> | <dbl> | <dbl> | <dbl> | <dbl> |
| v159 | 112 | 803 | 311 | 782 | 67 | 0 | A working mother can establish just as warm and secure an environment as a non-working mother | 2075 | 38.70 | 37.69 | 14.99 | 5.40 | 3.22 |
| v160 | 337 | 332 | 655 | 647 | 101 | 3 | A pre-school child is likely to suffer if his or her mother is working | 2075 | 16.00 | 31.18 | 31.57 | 16.24 | 5.01 |
| v161 | 477 | 163 | 769 | 523 | 138 | 5 | A job is alright, but what most women really want is a home and children | 2075 | 7.86 | 25.20 | 37.06 | 22.99 | 6.89 |
| v162 | 490 | 174 | 708 | 553 | 147 | 3 | Being a housewife is just as fulfilling as working | 2075 | 8.39 | 26.65 | 34.12 | 23.61 | 7.23 |
| v163 | 43 | 851 | 205 | 909 | 64 | 3 | Having a job is the best way for a woman to be independent | 2075 | 41.01 | 43.81 | 9.88 | 2.07 | 3.23 |
| v164 | 52 | 772 | 205 | 985 | 55 | 6 | Both the husband and wife should contribute to the family income | 2075 | 37.20 | 47.47 | 9.88 | 2.51 | 2.94 |
| v165 | 70 | 568 | 447 | 887 | 96 | 7 | In general, fathers are as well suited to look after their children as women | 2075 | 27.37 | 42.75 | 21.54 | 3.37 | 4.97 |
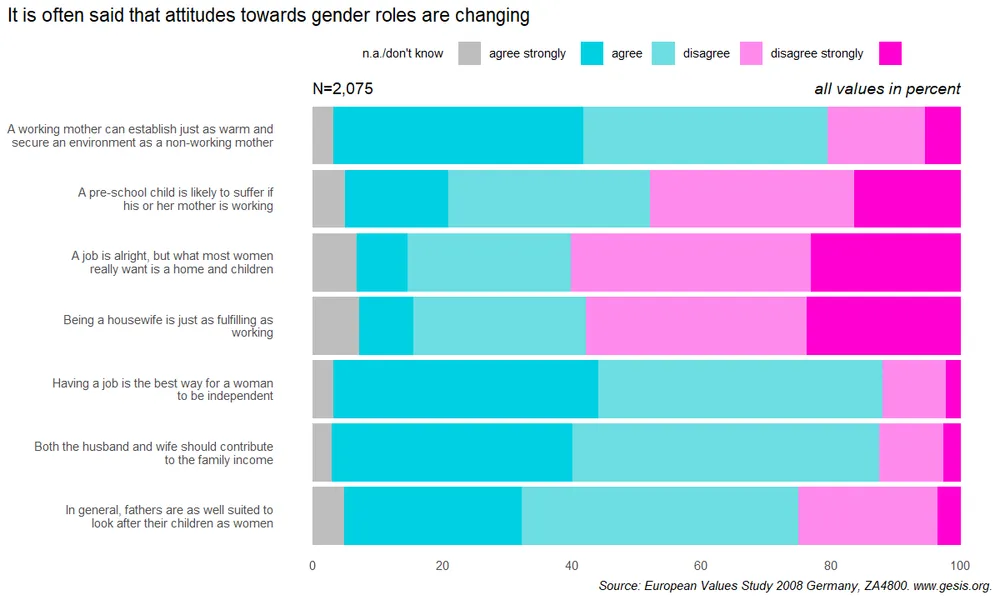
Target result
http://www.datavisualisation-r.com/pdf/barcharts_multiple_all.pdf
This is a stacked bar for multiple variables in the dataframe. So basically the dataset should be in the “longer” form. Let’s start
library(forcats)#Instead of using pivot_longer for 2-times-pivoted df pivot_evs
#We will create it from start, for our need.
#Explanation for friendly warning message "`summarise()` has grouped output by"
#https://stackoverflow.com/questions/62140483/how-to-interpret-dplyr-message-summarise-regrouping-output-by-x-override
evs_613 <- evs %>%
pivot_longer(cols=everything(), names_to = "Question", values_to = "Answer") %>%
mutate(Anstype = factor(Answer, levels = c(-2, -1, 1, 2, 3, 4),
labels = c("n.a./don't know", "n.a./don't know", "agree strongly", "agree", "disagree", "disagree strongly"))) %>%
#reorder the Anstype to reverse order
#mutate(Question = fct_reorder(Question, .desc=T))
#the default .add=FALSE group_by() will override existing groups.
group_by(Question, Answer, Anstype, .add=T) %>%
#Add summarized column after grouping
summarize(Count = n())[1m[22m`summarise()` has grouped output by 'Question', 'Answer'. You can override using the `.groups` argument.head(evs_613)| Question | Answer | Anstype | Count |
|---|---|---|---|
| <chr> | <dbl+lbl> | <fct> | <int> |
| v159 | -1 | n.a./don't know | 67 |
| v159 | 1 | agree strongly | 803 |
| v159 | 2 | agree | 782 |
| v159 | 3 | disagree | 311 |
| v159 | 4 | disagree strongly | 112 |
| v160 | -2 | n.a./don't know | 3 |
#Setting width and height
options(repr.plot.width=10, repr.plot.height=6)
#Remember to add discrete = TRUE in viridis
ggplot(evs_613, aes(x=Count, y=Question)) +
geom_bar(mapping=aes(fill=Anstype), position = "fill", stat = "identity") +
scale_fill_viridis(discrete=T, option = "plasma")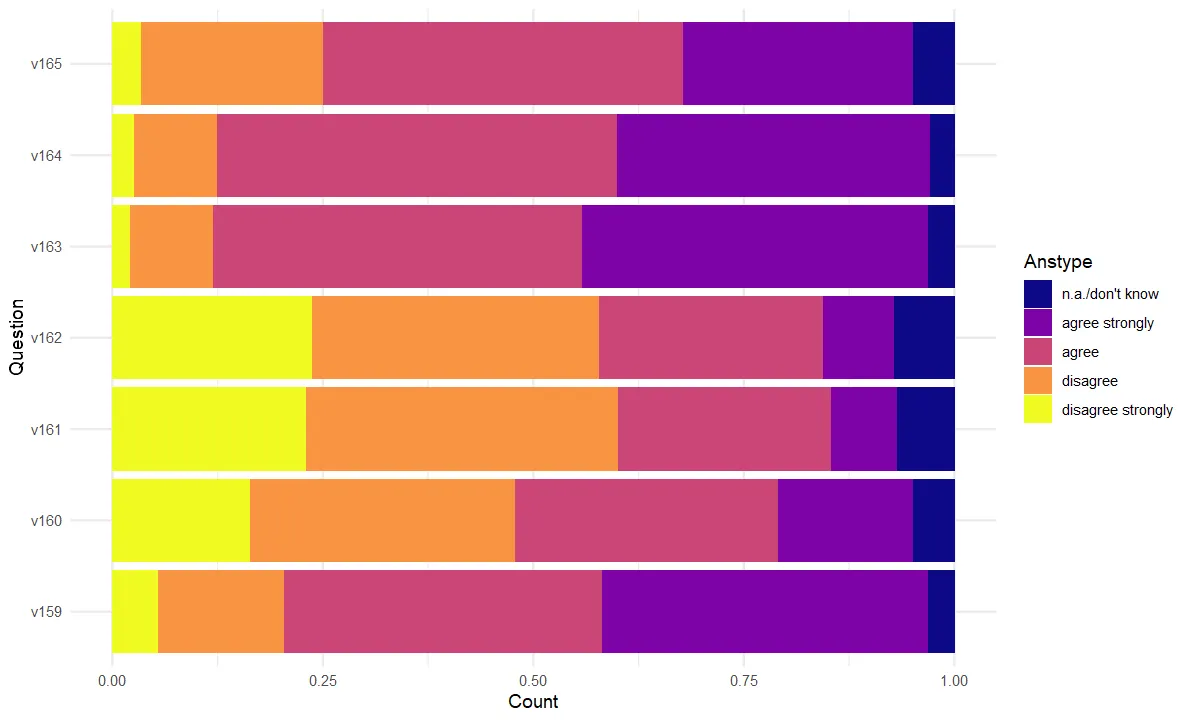
#Create custom color vector based on origin (using eye-dropper)
color_613 <- c("n.a./don't know" = "#bebebe",
               "agree strongly" = "#00d0e2",
               "agree" = "#6ddde1",
               "disagree" = "#ff8aee",
               "disagree strongly" = "#ff00d2")
#Result - seem easy?
ggplot(evs_613, aes(x=Count, y=Question)) +
#reverse position
geom_col(mapping=aes(fill=Anstype), position = position_fill(reverse = T)) +
#add annotate
annotate("text", x=0, y=7.75, label = "N=2,075", hjust=0) +
annotate("text", x=1, y=7.75, label="all values in percent", hjust=1, fontface="italic") +
#manual fill color
scale_fill_manual(values=color_613) +
#mapping label of y axis to description
scale_y_discrete(labels=Quesdesc, limits=rev) +
#edit the break label in x-axis and turn scale 1 to 100 percent
scale_x_continuous(breaks = seq(0, 1, 0.2), labels= function(x) x*100) +
#edit the labels
labs(x=NULL, y=NULL,
title="It is often said that attitudes towards gender roles are changing",
caption="Source: European Values Study 2008 Germany, ZA4800. www.gesis.org.") +
#changing theme
theme(panel.grid.major = element_blank(),
panel.grid.minor = element_blank(),
plot.caption = element_text(face="italic"),
plot.title.position = "plot",
legend.position = "top",
legend.title = element_blank(),) +
guides(fill = guide_legend(title.position = "right",
label.position = "left",
label.hjust = 0
)) +
coord_cartesian(clip="off")